David Rathgeber's
Real Estate Statistics
PERSPECTIVE
for the Experts
in plain English for real estate agents
as well as home buyers and sellers
International Standard Book Numbers
0-9710312-8-2 and 978-0-9710312-8-9
Published by The Realty Research Group, LLC
Copyright © David Rathgeber – All Rights Reserved
You are hereby authorized to read this copy on your screen and to print one copy for personal use. You are NOT authorized to make any additional copy of any nature: paper, electronic storage media, or otherwise without the express written permission of the author.
Foreward: To the experts
I did not want to write a fourth real estate book but here 'tis. It is written for real estate media experts, whose comments appear on radio and TV, and in print. I have been there on occasion, but that is water over the dam. But I’ve also done something that none of you have done; spending over 3 decades developing actionable information for individual home buyers and home sellers. Long ago, I had a real job applying my education in science and mathematics, and that has provided a unique perspective to share.
But we need to start with a mission statement: To provide the most accurate and timely information for buyers and sellers of resale homes. That is obviously your largest group of viewers, listeners, and readers, by a wide margin. If your target audience consists mainly of macro-economists, home-builders, and your editor or producer, or if you just don’t give a hoot; save your time. Also, save your time if you have been granted a full set of real estate knowledge, genetically, at birth.
While you certainly have time and space to fill and deadlines to meet, there are always ways to do any job better. Being a simple person (as I’m constantly reminded by my friends) I have written this in plain English, consumable by anyone. So remember; in your audience are potential buyers and sellers, and some may have also read this book. Keep an open mind and read on, to obviate needless embarrassment.
Introduction: To the experts
This is an in-depth analysis of real estate statistics, how they are developed, what they mean, and how they should, and should not, be used. Too often, real estate information that sounds important, is patently useless. It is hoped those of you employed in the media can acquire a new perspective, see through the fog, and refine your ability to provide actionable information for your audience in a timely manner. Gain the ability to drill down to details that, when time permits, allow you to explain how and why your report is useful.
If you are generating regional news, it will be helpful if you gain access to the local MLS (Multiple Listing Service) database. Alternatively, you could hire someone to do it. If you are developing a national news spot, you will need to rely on others for information. In any event, insight gained here will enable you to develop raw data that is meaningful, or alternatively, ask your sources pertinent questions. When you find a source who understands your question, you likely have found a winner.
While the author has owned homes overseas, the bulk of his real estate experience is in the United States. Data to support the charts and conclusions herein has generally come from the Washington, DC metropolitan area. This is one of the largest real estate markets in the world, and has been served by MLS systems that have collected valuable data. The author has mined this data on the first of every month for over 3 decades. Raw data is available upon request.
[Click here to return to top]
CONTENTS
Comparing data
Demand for homes (with chart)
Supply of homes (with chart)
Market Strength (with chart)
Market Seasonality (with chart)
Short-Sales: A disturbing influence
Market Prices (with chart)
Statistical Significance
Days on the Market (with chart)
Days on the Market vs. Asking Price (with chart)
Showing Traffic
Selling-Price to Asking-Price Ratio (with chart)
Vacant Homes (with chart)
Dollars per Square Foot
Tax Assessments
Interest Rates
Housing Affordability Index
New Home Data
Average vs. Median
Methodology
APPENDICES
The items below are mini-case-studies and food for thought, in order to provide additional perspective.
What are they talking about?
Are home values dropping 12% monthly?
A self-fulfilling prophecy!
A market report
Even the BIG boys can mess up
Discrimination in housing: Perspicacity
Some get misinformation, and never know! Scary?

About the Author
****************************
David Rathgeber ranks consistently among the top award-winning agents and is actively engaged in sales and marketing of residential real estate in Virginia. His comments and articles have appeared frequently in major newspapers, and he has written for the national REALTOR Magazine. He often appeared on the national award winning TV show The Home Guide Show as well as on other TV news programs. His books incorporate the wisdom of over 3 decades of real estate experience along with his diverse technical and international business background. He holds a degree in Mechanical Engineering and a Master of Business Administration.
CONTENTS
Comparing data
A most important fact to keep in mind: Although data can be collected, averaged, and reported for individual states or the entire U.S., the information is merely recreational. It has absolutely no relevance whatsoever to individual buyers and sellers in your audience. It is suggested that each and every time such data is referenced in a report, you finish up with the following: “You are reminded that there is NO national real estate market; all real estate is local.”
Always consider your source. It is safer to assume that data from one reporting source cannot be compared to that from another. Next, be sure of what area is being reported. There are significant regional variations even within a single metropolitan area. In short: Compare apples to apples.
Real estate markets are seasonal. As data is generally reported in monthly increments, 2 comparisons make sense:
- Comparing recent data to the same month last year.
- Comparing recent data to data from the previous month.
The first comparison tends to remove seasonality and provides a long-term view. The second comparison tends to include seasonality and provides a short-term view. However, they are both comparisons of 2 bits of data. If the individual monthly data points (e.g. averages) contain a lot of noise or bounce, the resulting comparison is subject to the same inaccuracy. This is often the case for average home prices, discussed later.
Always check whether data is recent, or several months old. If data is 6 months old it is worse than useless. From what perspective is the data analyzed? For longer-term data; how were the start and end dates selected? For example, there are very different views if home price appreciation to date is portrayed as starting in 1990 versus starting in 1998, 2006, or 2009!
Why was the data analyzed? The methodology will influence its usefulness. Was it prepared to help:
- Investors in the stock market?
- Macro-economists predict the future?
- Media folks fill some column space?
- Radio or TV folks prepare a sound bite?
- Home buyers and sellers (that's your audience)?
Massaging the data is a bit more complex than it seems on the surface. How it is done can matter and big mistakes are made. If you are looking to assemble actionable information, you need to be sure.
Determine what is included in your source data. Is the data for resale homes? Is it diluted by inclusion of:
- Rentals?
- New homes?
- Commercial properties?
- Re-finance appraisals?
Is it limited by inclusion of only:
- Repeat transactions?
- Single family homes?
- Distress-free properties?
- Sales with certain types of loans (for example, conventional)?
- Sales with loans lower than a given amount (for example, "conforming" loans only)?
Does the data include short-sales, and what is the effect? Is it seasonally adjusted? Is it inflation adjusted? All of the above are complicating factors in the assembling of data, and they can make a significant difference, especially for average home prices where the number of data points controls the accuracy of the result. This is very important to a buyer or seller of a resale home, and these are distinctions often lost on the folks collecting, massaging, and providing your data.
Again, national averages are important for macro-economists, but merely useless bits of information for a homeowner.
Also see the comments on Statistical Significance.
[Click here to return to top]
Demand
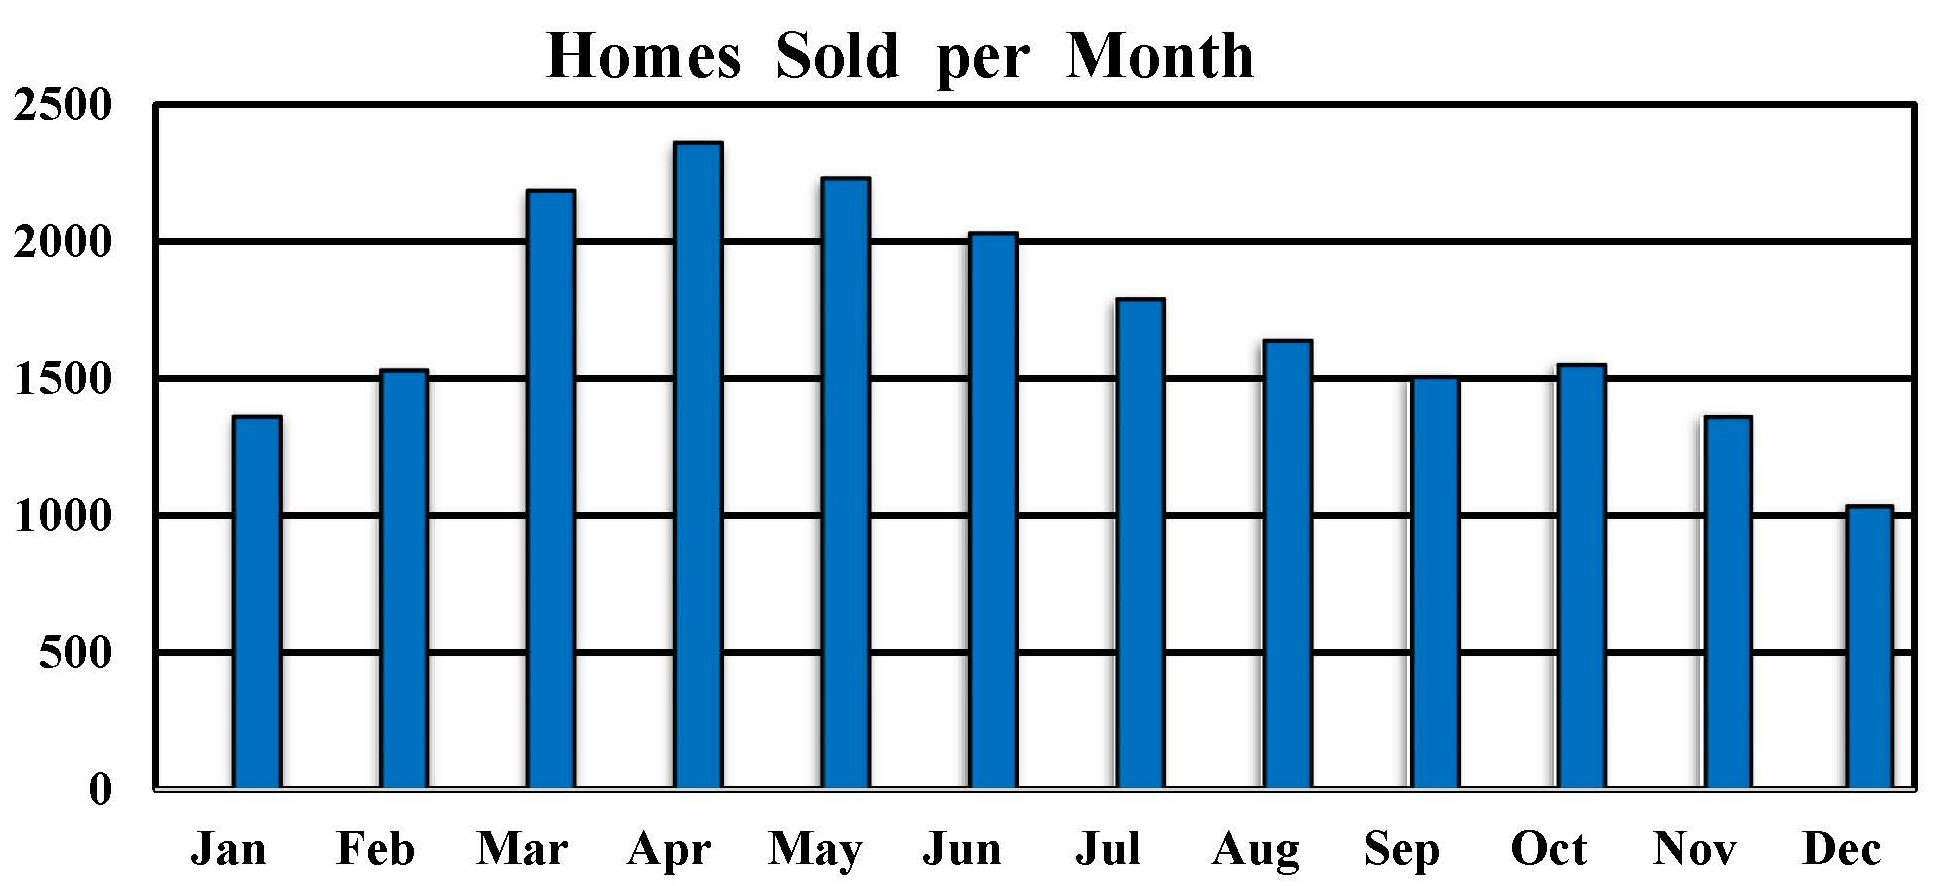 Demand alone is of almost no importance to home buyers and home sellers. Without supply, it is only one side of the story. It generally need not be reported as it would only serve to dilute any main message.
However, note that peak sales often occur in April, not the summer "when the kids are out of school" as you might have been reporting. The graph above is based on contracts entered, not sales closed. Buyers and sellers, need to know about contract activity. They do not care when, or even if, the sales go to settlement. Further, demand not only fluctuates seasonally, but also varies with macro-economic trends on a 15 to 20 year cycle.
And for heaven's sake: If you do focus on demand, remember that February has 10% fewer days than January!
[Click here to return to top]
Supply
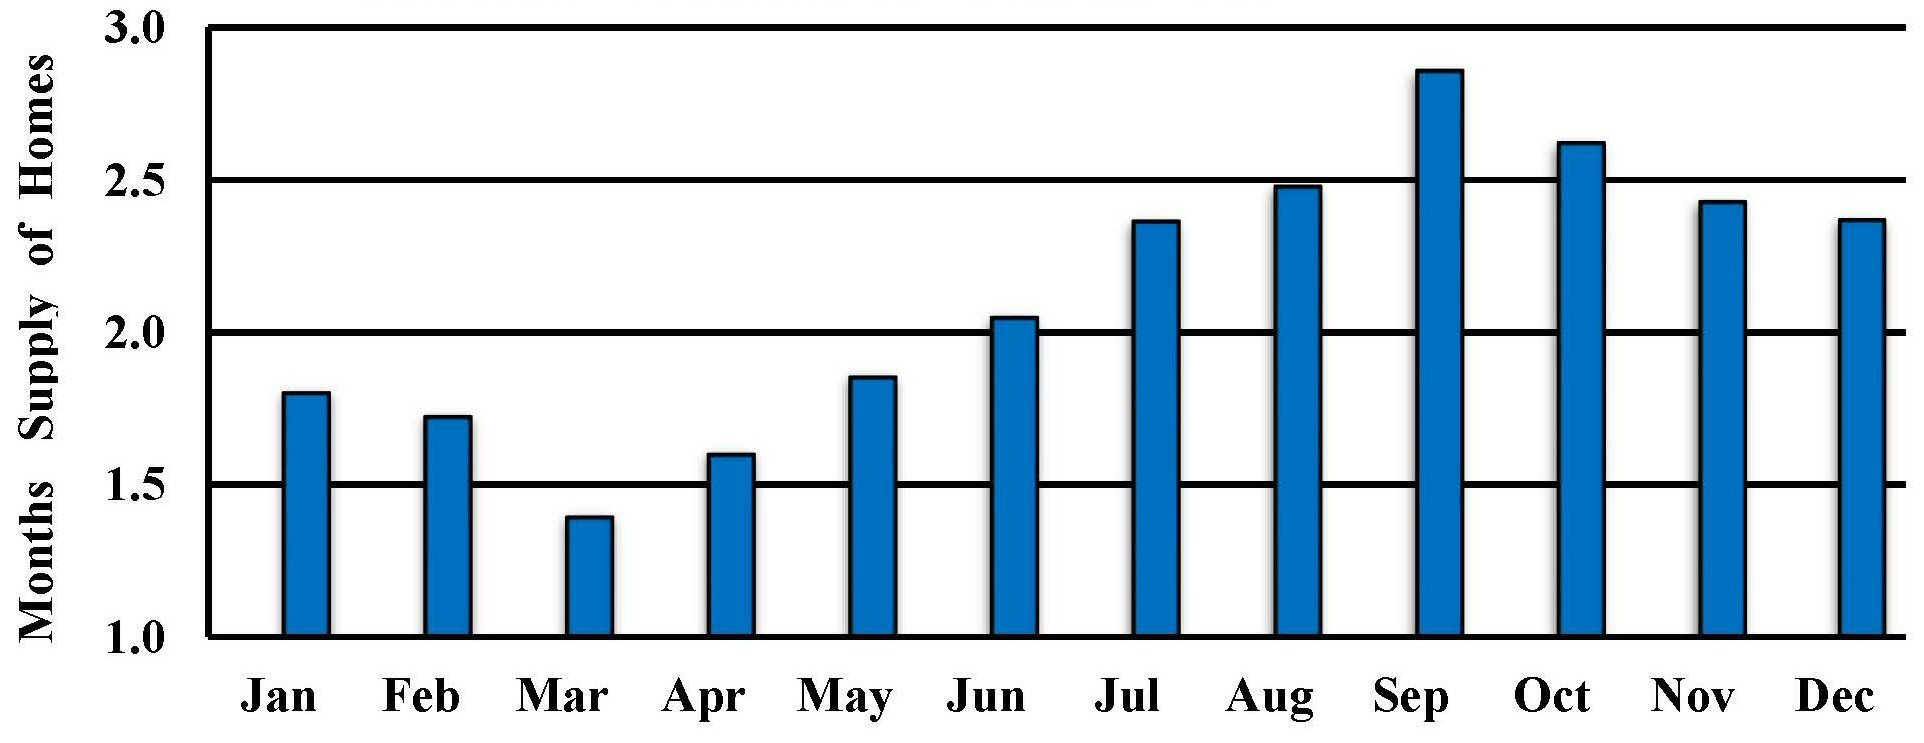
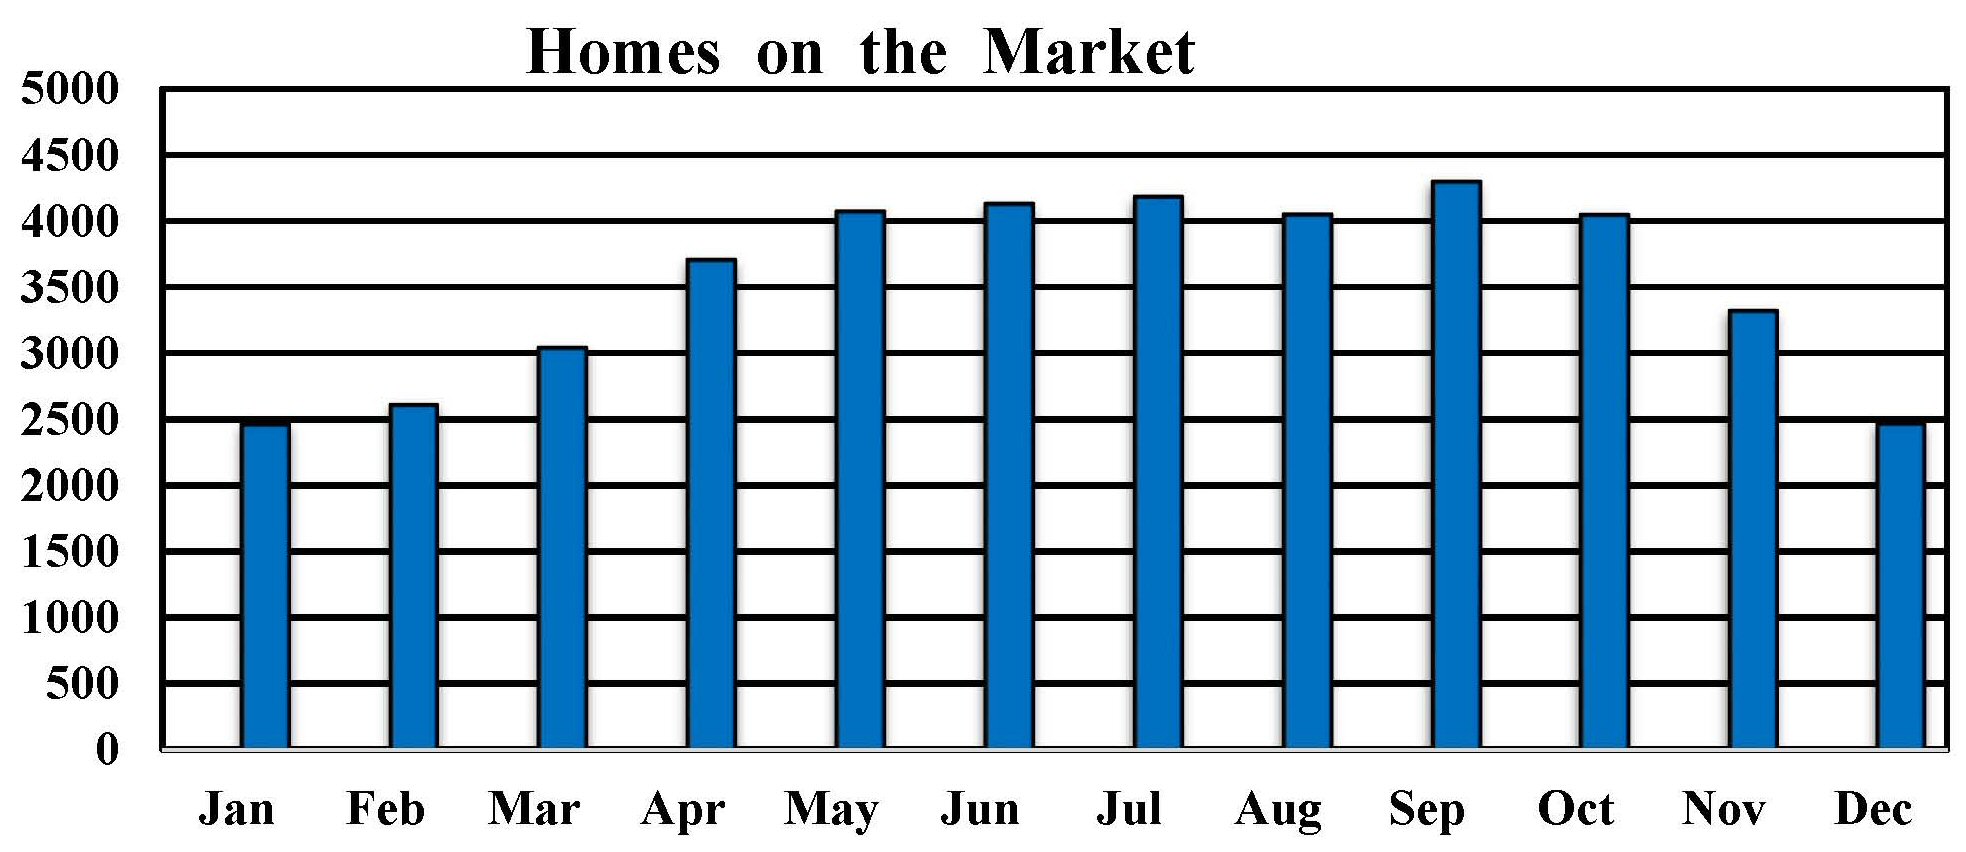 Supply alone is of almost no importance to home buyers and home sellers. Without demand, it is only one side of the story. It generally need not be reported as it would only serve to dilute any main message, but do notice how little supply might vary from May to October. This is discussed later under Market Seasonality.
The percentage of foreclosures, short-sales, and vacant homes compared to all homes on the market can sometimes be of importance. They should be reported when they have the potential to affect buyers, sellers, or average home prices. Lower percentages of distressed properties are better for sellers. Higher percentages are better for buyers, because distressed properties imply market softness and can apply downward pressure on prices.
[Click here to return to top]
Market Strength
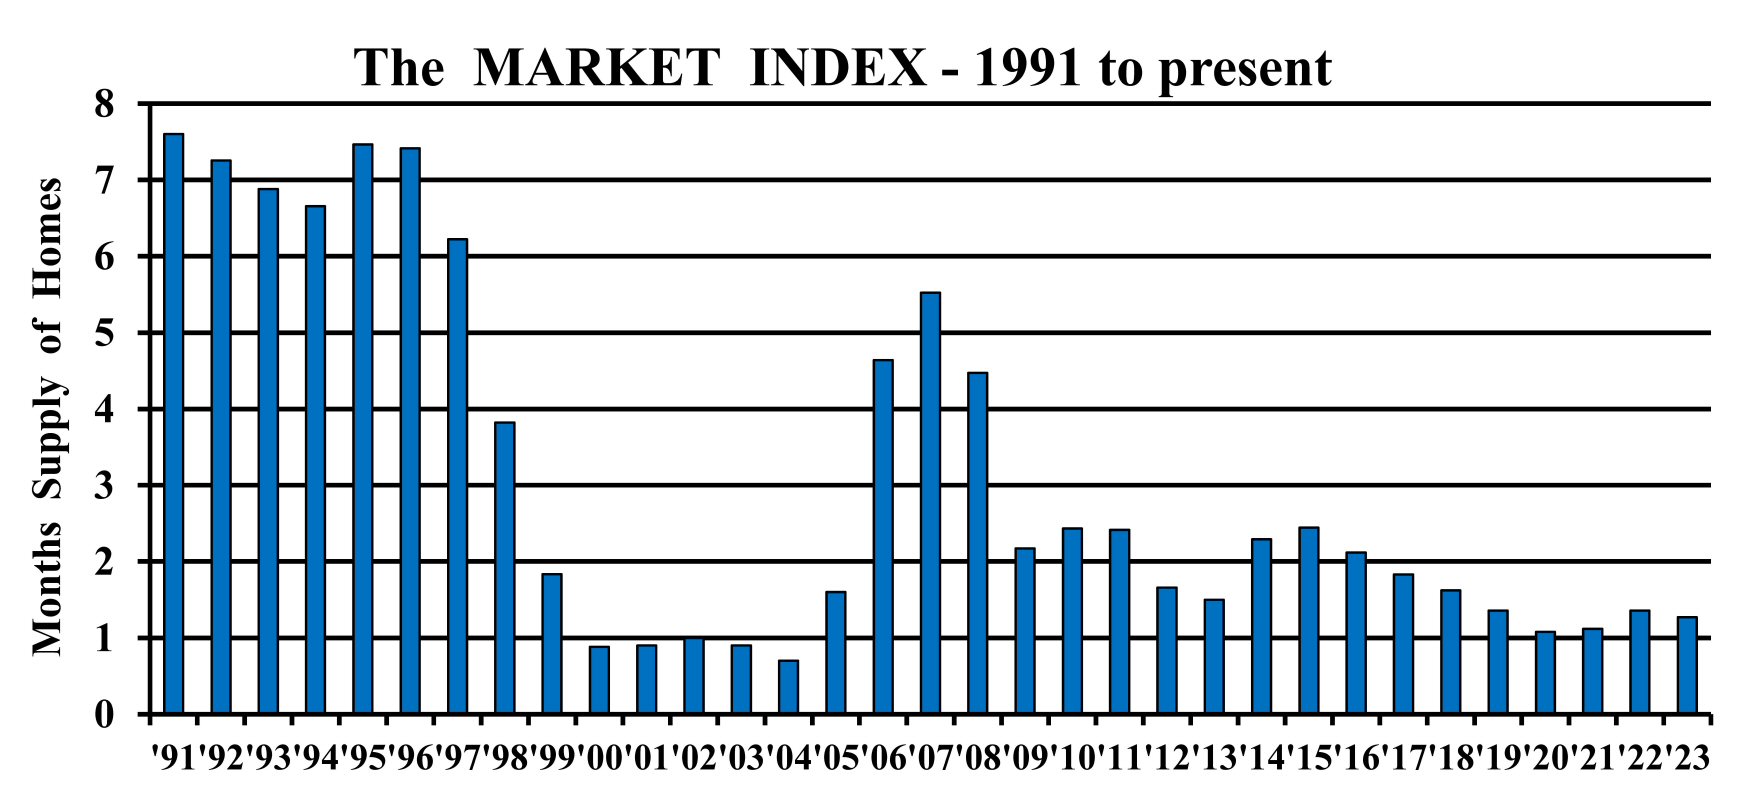 The single most important real estate statistic is the Months Supply of homes on the market shown above. A number greater than 5.0 indicates that buyers have the upper hand. A number lower than 3.0 favors sellers, and less than 1.5 indicates a hot market.
To obtain this figure, the number of homes on the market is divided by the number of contracts entered (often called pending sales) for the previous month. The focus is on resale homes: Rental properties and brand new homes need to be excluded from the calculation.
Home sellers can use the information as a measure of:
- how to price their home
- how long their home might be on the market
- what pace is best when negotiating an offer
- how likely they are to obtain two or more concurrent offers.
Home buyers can use the information as a measure of:
- how soon they need to view homes new on the market
- how long they can "think about" a property of interest
- the likelihood of other offers appearing during negotiations.
Months Supply is the most important statistic because it incorporates both supply, demand, and the effects of home prices, interest rates, and local economic conditions into a single real-time indicator. A monthly reading can be available with essentially no delay or distortion by using the number of contracts entered, that is pending sales, NOT closed sales. Nearly all pending sales proceed to closing. More importantly, pending sales represent actual contracts; whether they close or not is irrelevant.
One way to view the Months Supply of Homes: With a 4 Months Supply, if buyers kept buying at the current rate and no new homes entered the market, after 4 months there would be no homes left on the market. Of course this never happens, but merely serves to illustrate the concept.
There is a distinct seasonality (see below) to the real estate market, which is reflected in the Months Supply. This means that certain times of the year are somewhat more advantageous for home sellers (March?) and other times are more advantageous for home buyers (September?). You cannot beat timeliness coupled with accuracy!
Note: The inverse of Months Supply is sometimes reported as the Absorption Rate. For example, a 3 Months Supply is the same as a 25% Absorption Rate.
[Click here to return to top]
Market Seasonality
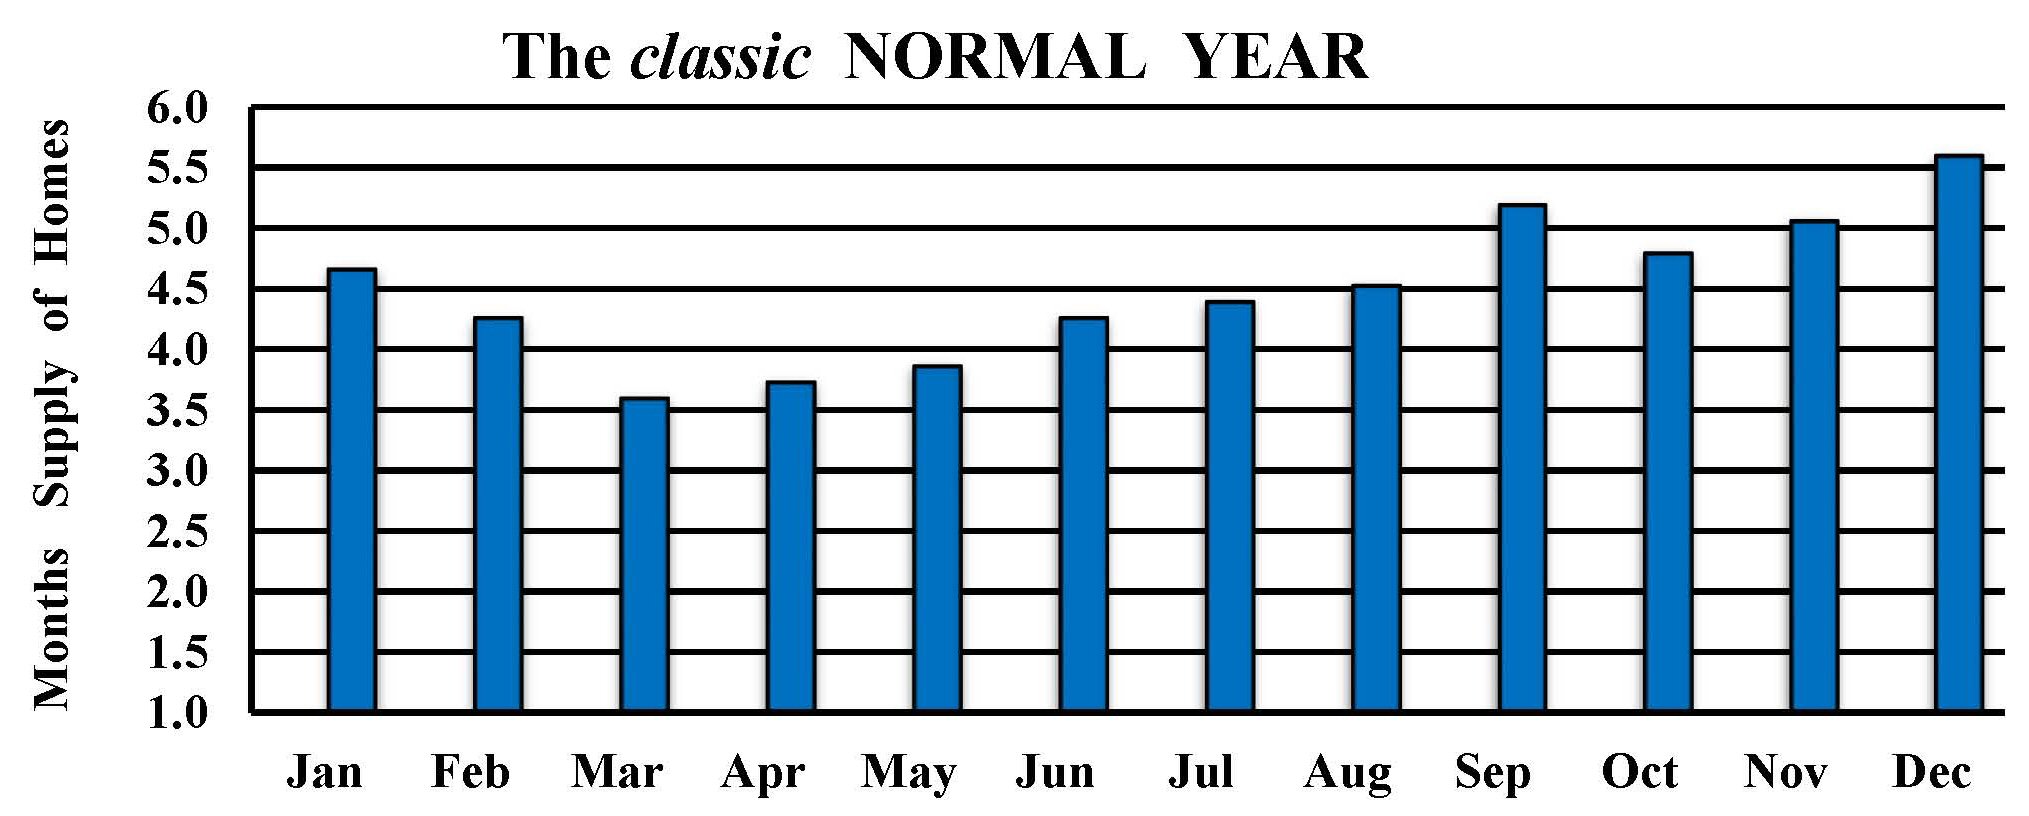
The graph above incorporates supply and demand into a single number and shows the seasonality of the real estate market. This is the classic case of how the market should behave. It shows sellers having their best market in March, not June and July as you often hear. It shows buyers doing best in December. Note the September "slump."
The graph below shows the seasonality of one major real estate market for several recent years. Sellers still have their best market in March, not June and July as you often hear. But buyers now do best in September and then months supply decreases for the rest of the year. Could this be your new normal.
What might have changed? Here are some clues:
- The seasonal pattern and shape of the demand (number of homes sold) chart has not changed with peak sales occurring in April most years.
- The seasonal pattern and shape of the supply (homes on the market) chart has flattened. There is now very little change in supply from May to October, and the average number of days on the market is much lower than before.
- Both supply and demand are decreasing in the final months of the year as always, but the decrease in supply has become the controlling factor.
Short-Sales: A disturbing influence
Short-sales had a disturbing influence on market data for a few years. While foreclosures and vacant homes generally are sold and closed in relatively normal time frames, short-sales can take much longer. Many buyers will not even view them, so they languish on the market. Therefore, including them in homes on the market increases Months Supply figures un-naturally. In other words, they look like inventory but really are not. Excluding them altogether from the calculation would also be misleading because they are of interest to a limited number of buyers.
Further, a significant proportion of short-sale contracts never get to closing, which results in more than one contract per property. As buyers get discouraged and bail out, it makes way for second, third, and more successive contracts (not to be confused with multiple offers) on the same property. While this tends to offset the effect of inflated inventory described above, there is no way to determine to what extent this happens.
The number of short-sales has declined significantly since 2008. At this point, the disturbing influence on data is negligible, but this could change.
[Click here to return to top]
Market Prices
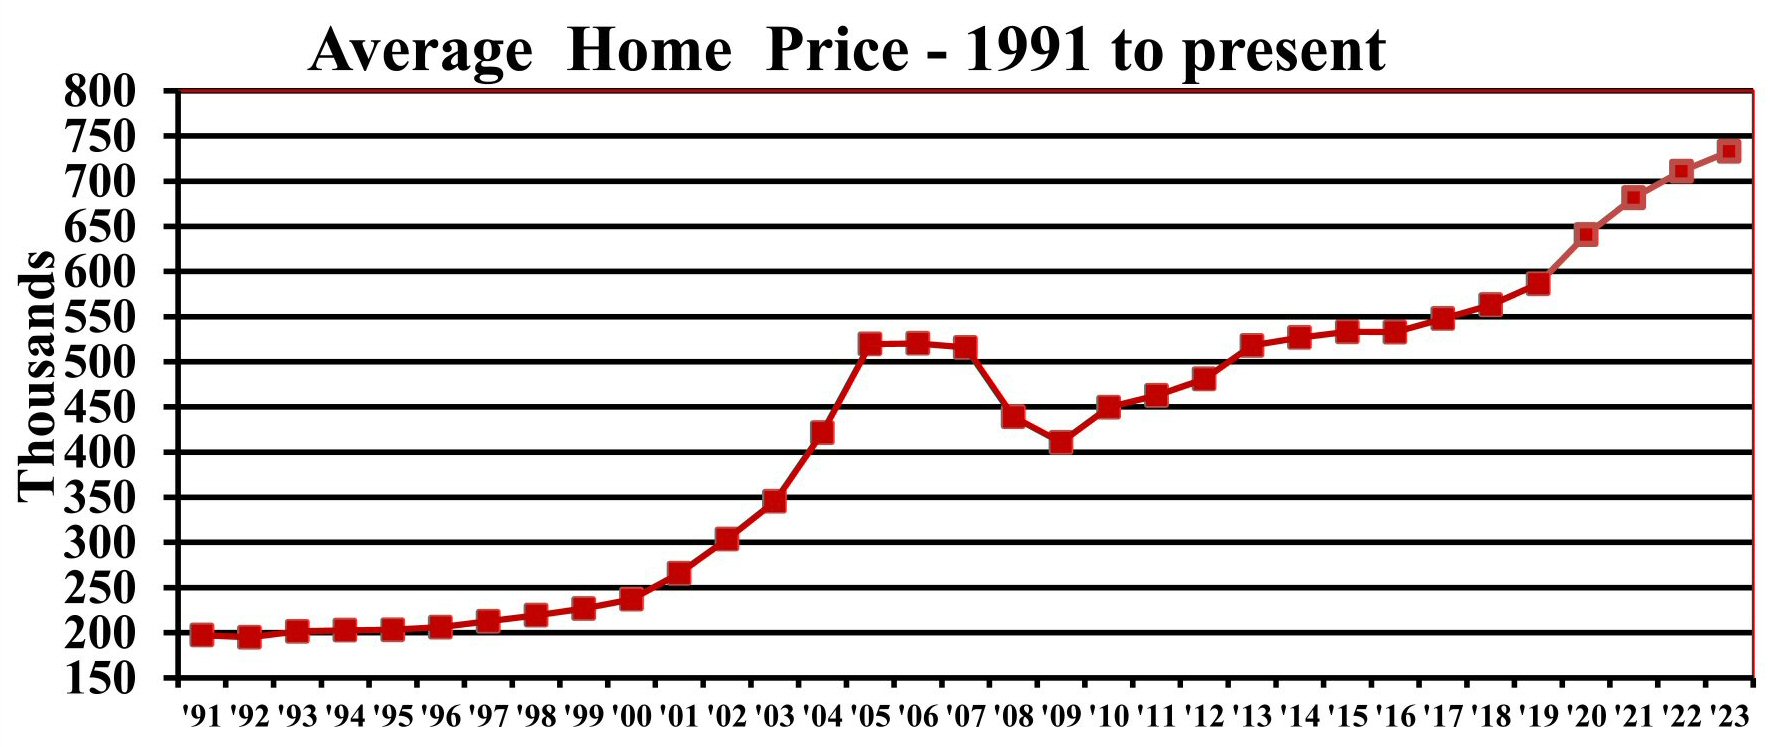
The graph above displays the Average Home Price trend for one major market from 1991 to date. Note the unusually slow market of the early 1990's when home appreciation was nil for 6 or 7 years. Then the market heated up dramatically until the average price peaked at $568,074 in June 2006 then started to decline, hitting a low of $359,660 in December of 2008.
Ears always perk up at the mention of home price data, but the information is generally recreational rather than actionable. The average home price can rise or fall in two ways:
- Due to general appreciation or depreciation of all homes. This is what is assumed when folks hear the data.
- But the average home price can also change even if individual home values do not. How is this possible? Simply, if the distribution (or the mix) of sold homes changes, for example, by a higher proportion of expensive homes being sold.
Trying to distinguish between these two effects by looking at the medians instead of average prices, it appears that the medians and averages generally rise and fall together. So this seems to be of no help. Nevertheless, if a trend is indicated, and it has resulted from general appreciation or depreciation, it can be valuable in the following ways:
For home sellers:
- If prices have been increasing, sellers might elect to not reduce their overpriced listing that is getting too few showings, and wait for prices to rise to their level.
- If prices have been decreasing, sellers will need to reduce their overpriced listing by a rate greater than that of the market declines in order to ever sell.
For home buyers:
- If prices have been increasing, buyers might be willing to pay several percent above the asking price for a home with the reasonable expectation that in a few months they will recoup their "loss" and forget their indiscretion.
- If prices have been decreasing, buyers will have no sense of urgency because they can expect greater value for their money later.
Note that a price calculation can be done for homes currently on the market or for only those homes that have recently sold. The on the market calculation yields average prices much greater than the average for recently sold homes. But numbers generally quoted are for sold homes, so buyers and sellers contemplating action need to be reminded that this is old news. How old is it? It is often 3 to 6 months old: Two unavoidable months old due to data collection limitations (the lag between contract and closing) and another month or two for data assembly, review, comment, and publication. It is critical to understand this, because taking action on 3 to 6 month old data can be a disaster.
The concept of statistical significance is germane to this discussion as many of the average prices reports are worse than meaningless; they are misleading. See Statistical Significance below.
[Click here to return to top]
Statistical Significance
Statistical Significance is a mathematical concept, too infrequently applied to real estate data. It states that in order for a conclusion to be meaningful, it must be based on a sufficient number of observations or individual data points. A complete treatment of the subject is far beyond the scope of this author, but the concept is important: Depending on the set of data being analyzed, there is a certain minimum number of individual data points required in order for the conclusion to be reliable, valid, or useful. Inaccuracy due to an insufficient number of data points is sometimes called "statistical bounce." Such inaccuracy exists in most published reports of average home prices, often to an alarming extent.
Of course, there is a reliable statistic called average home price which changes over time in some orderly fashion (i.e. without excessive noise or bounce). The intent of an average price calculation is to measure the change in price for all homes in a specific area by calculating an average of those homes that have sold recently. In other words, trying to measure an entire population with data from a small portion of that population.
Note to statisticians: Home price data bears no resemblance to the classic "normal" distribution. Using such formulae to measure precision does not work. While calculated averages will be mathematically correct, drawing a home price implication for an entire population from less than 1% of its data, is a bit more complicated.
An empirical analysis was performed on a 3 month sample of sold homes. There were nearly 10,000 data points (sold homes) in the sample; enough to provide a reliable average. When random samples roughly representing one month (3,300 solds) were analyzed, the average price was found to be within 4% of the correct value about half the time. When random samples of 20 solds were analyzed, the average price was found to be within 10.6% of the correct value about half the time.
To summarize, an average of 10,000 solds results in a reasonable confidence level for an average price calculation in order to provide valuable, actionable information. As few as 3,300 solds can be useful if viewed with skepticism: But if the average home price changes less than 1% in a month, a monthly number that can be 4% off is worthy of skepticism! When published data bounces around from one report to the next, it is the result of insufficient data.
For example, an average price can be calculated for any zip code, but to get to 10,000 solds would take years and years of data, so any accurate reading would be based on data which is, on the average, many years old; again, meaningless. This is why average home prices in any zip code for any month, or even a year, are patently meaningless: The data sample size is not large enough over a short enough time. Nevertheless, average price calculations which are based on less than 20 data points are often reported! Many have no concept of statistical significance and will report anything, useful or not. The fact that someone found some numbers and calculated an average might be good enough for them, but not for savvy folks like us.
[Click here to return to top]
Days on the Market - DOM
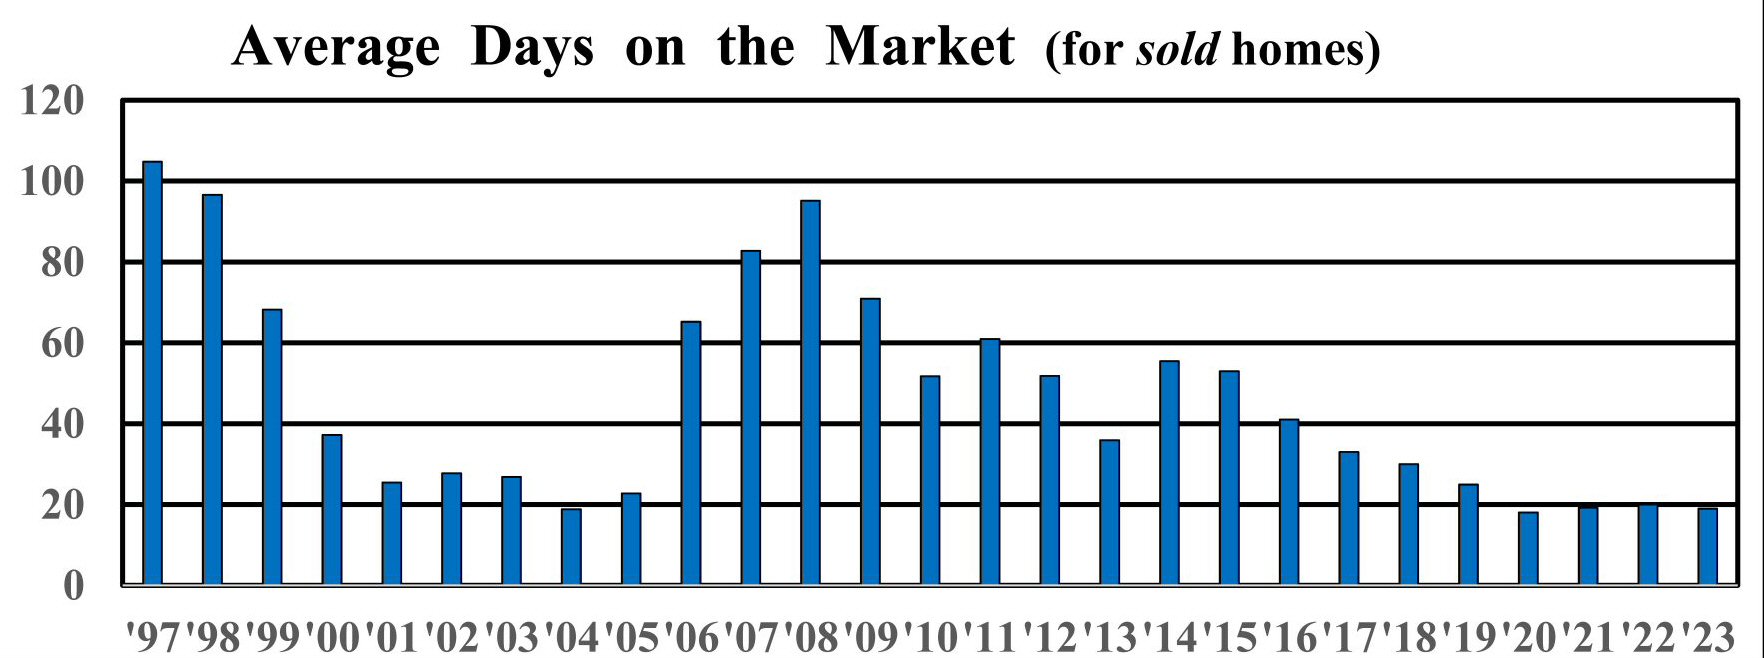
DOM should be an important statistic, but the interpretation is too tricky: The calculation can be done for all homes on the market, or for only those homes that have sold recently. In the latter case, days to agreement, days to removal of contingencies, or days to closing might be the figure that gets reported. To further compound the problem, some MLS systems compute DOM using only the current listing of a home, some account for previous un-sold listing entries of the same home, some systems provide both figures, and some provide no information at all.
To add still another level of problem-compounding-complexity: The most useful, DOM at the current price, is often difficult or impossible to determine. And finally, at the risk of TMI, no one ever tells you which number they are reporting! To be useful, DOM should be calculated as days to agreement, at the final price, for recently sold homes. The MLS computer-weenies all know how to calculate an average, but none of them know or even care whether it is useful to anyone.
Using DOM in an ideal world for home sellers:
- DOM for all homes currently on the market including previous listings thereof can be doubled and used by a seller as a worst-case scenario for planning purposes.
- The number of days it took to sell half the homes that have recently sold (i.e. the median) can be used to indicate the time when a seller should start to consider a price reduction.
When the market speaks, sellers need to listen, but remember that any sold data lags by 1 or 2 months, plus the time needed for data assembly and publication.
Using DOM in an ideal world for home buyers:
- If buyers hear a high number, some will assume they can postpone action; but many find that needless delays are extremely unwise.
- In delaying action buyers are "playing with fire" due to the extreme variability of results and the propensity of other buyers to pop up at the wrong time and buy their home of choice.
Due to the complications noted above, it is recommended that published DOM should only be used with great caution. Comparing same-source figures from last month or last year might indicate which direction the market is headed, but better indicators are available.
Important note for your home buyers: Delays normally favor home sellers, so buyers should never delay a decision or the negotiation unless absolutely necessary. The risk is having to live forever in their second-choice home. Further, they should never ask how many days a home has been on the market, but ask how many days the home has been on the market at the current price.
[Click here to return to top]
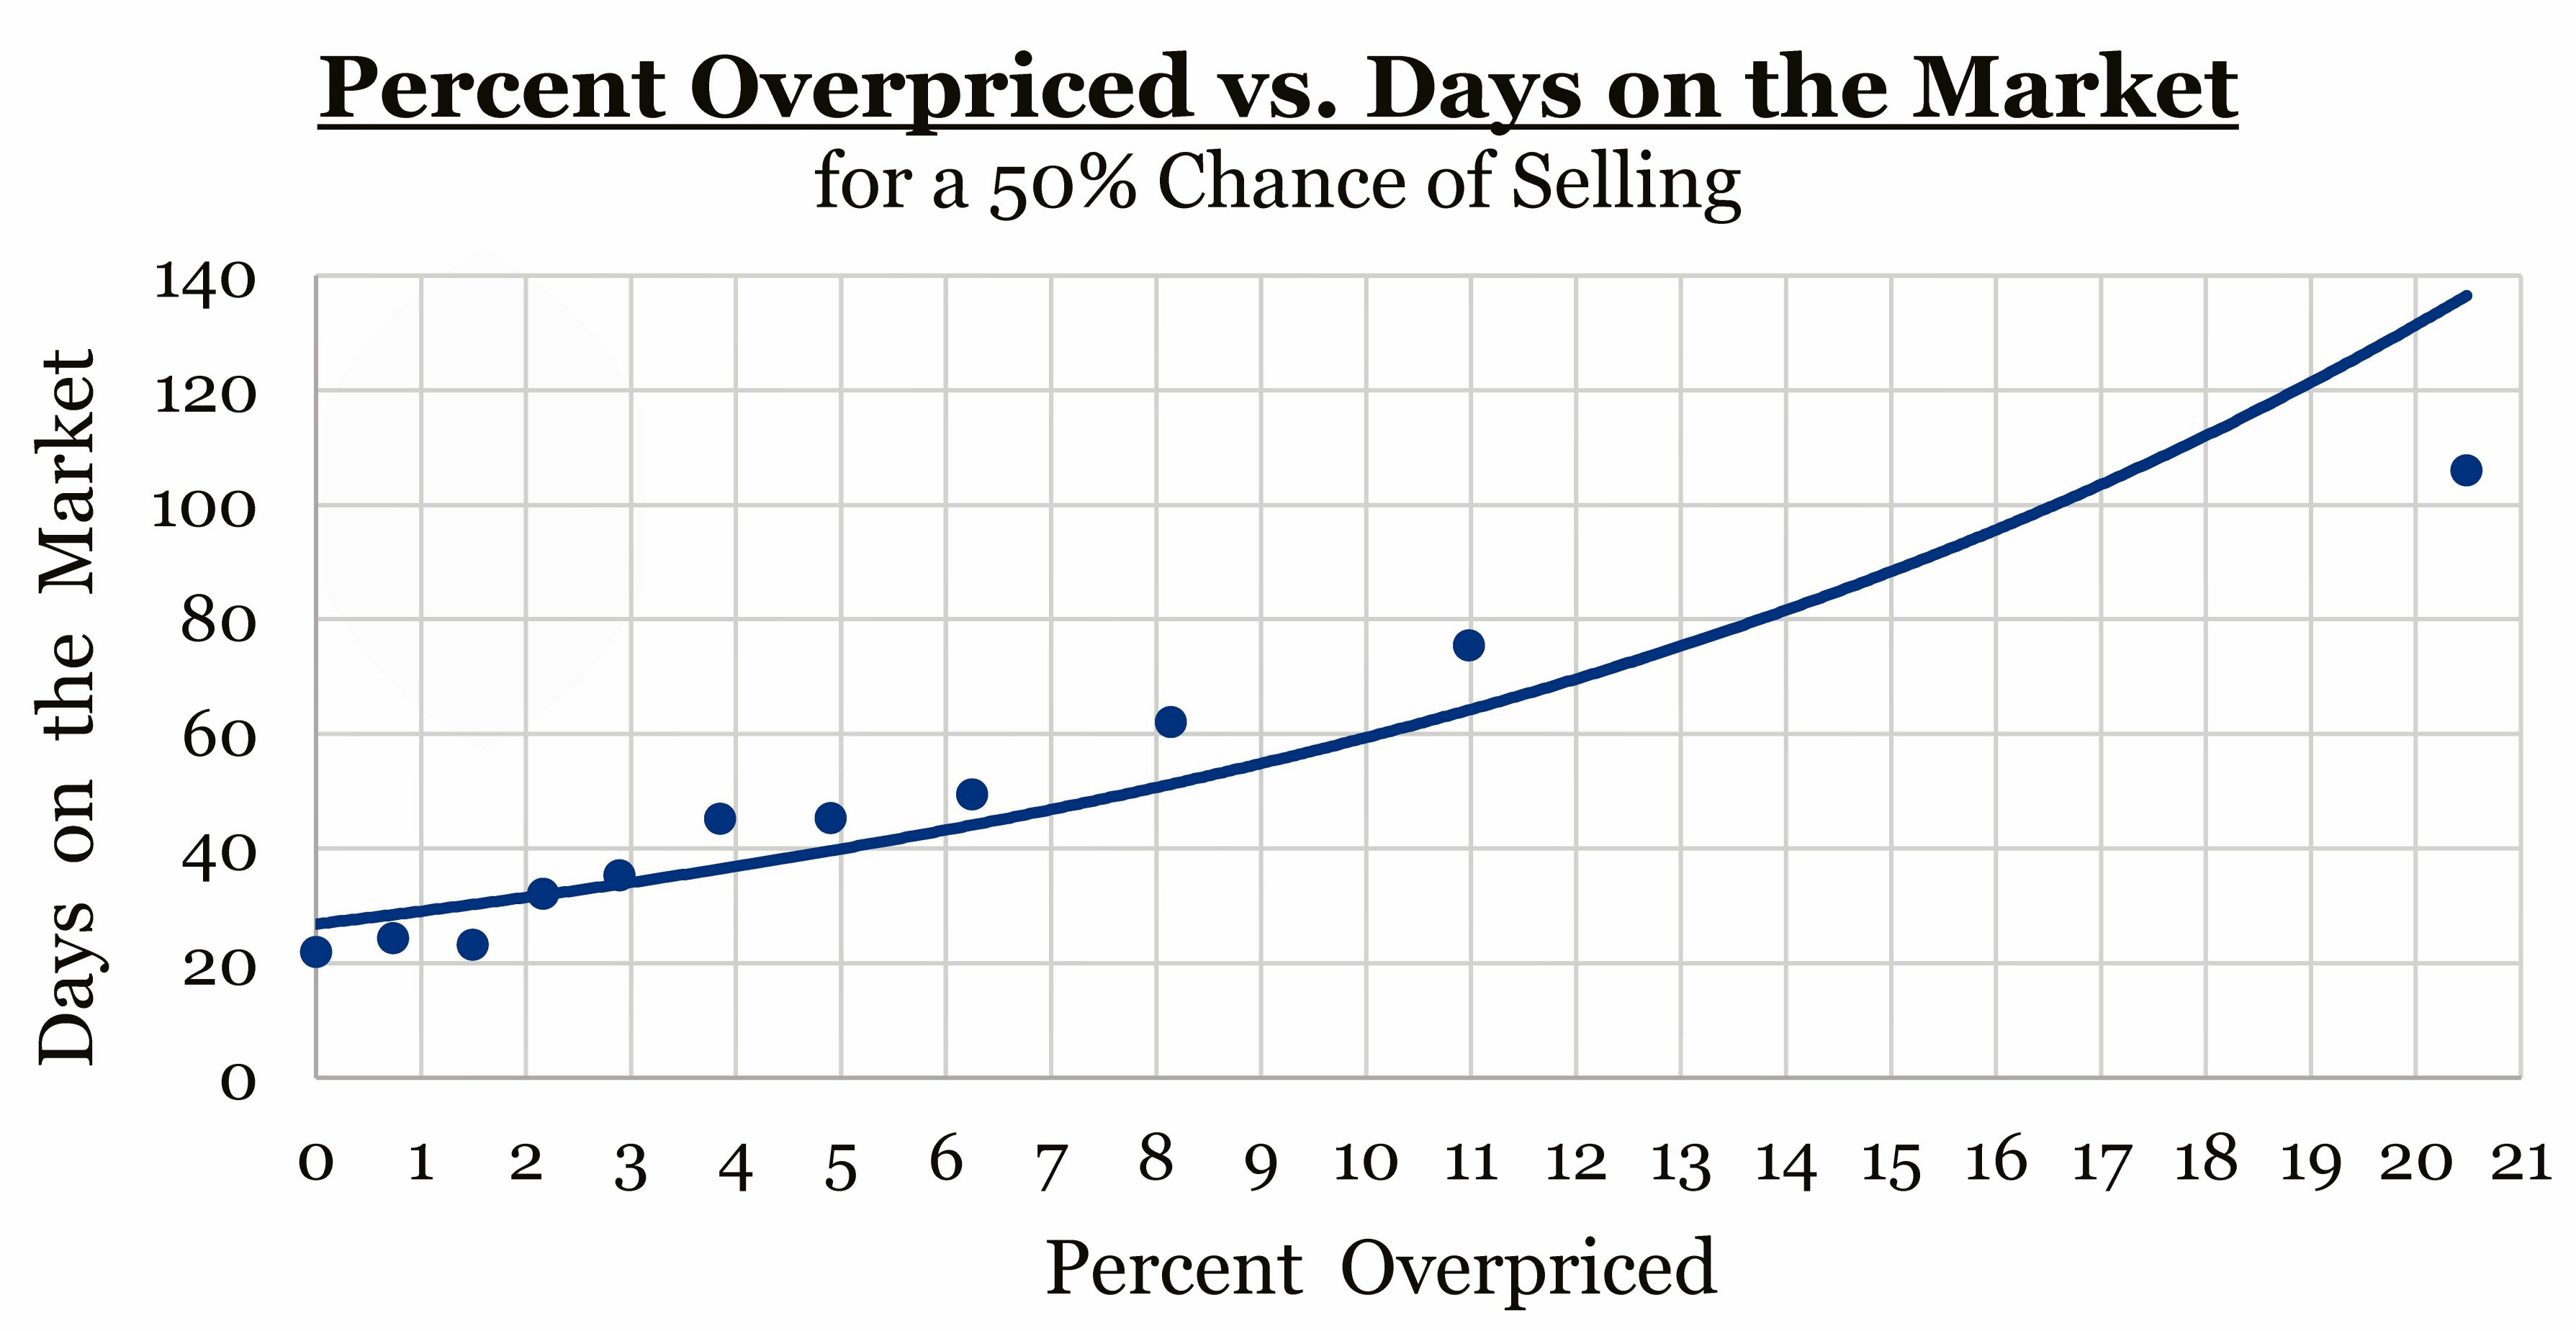
Days on the Market vs. Asking Price
The graph below illustrates the relationship between a home's time on the market and its asking price. When a home is 5% overpriced, it's a full level of perspicacity out of touch with the market. The home will be shown to the wrong buyers: Those who really want and can afford a better home. It will not be shown to the proper set buyers because they think they can't afford it.
Note: When a home goes on the market, no one knows its exact market value. (No, not even Zillow, or the tax assessor!) When setting an asking price, after a careful analysis, check whether average prices are rising or falling annually as well as seasonally, and always check the all-important months supply.
[Click here to return to top]
Showing Traffic
The very best market indicator for home sellers is the number of showings the home receives every week. Reasonable expectations vary greatly by the health of the market, seasonality, price range, and proximity to the geographic center of the region's market. But if no one came to see the home in the last 2 weeks it is in trouble: The answer is likely on the sheet that comes out of the printer from the MLS. Often, but not always, it is the home's asking price. This is not rocket science; there is no magic involved in selling a home. Of course, you will only be able to deal with this seller-specific detail in a very general discussion.
[Click here to return to top]
Selling-Price to Asking-Price Ratio
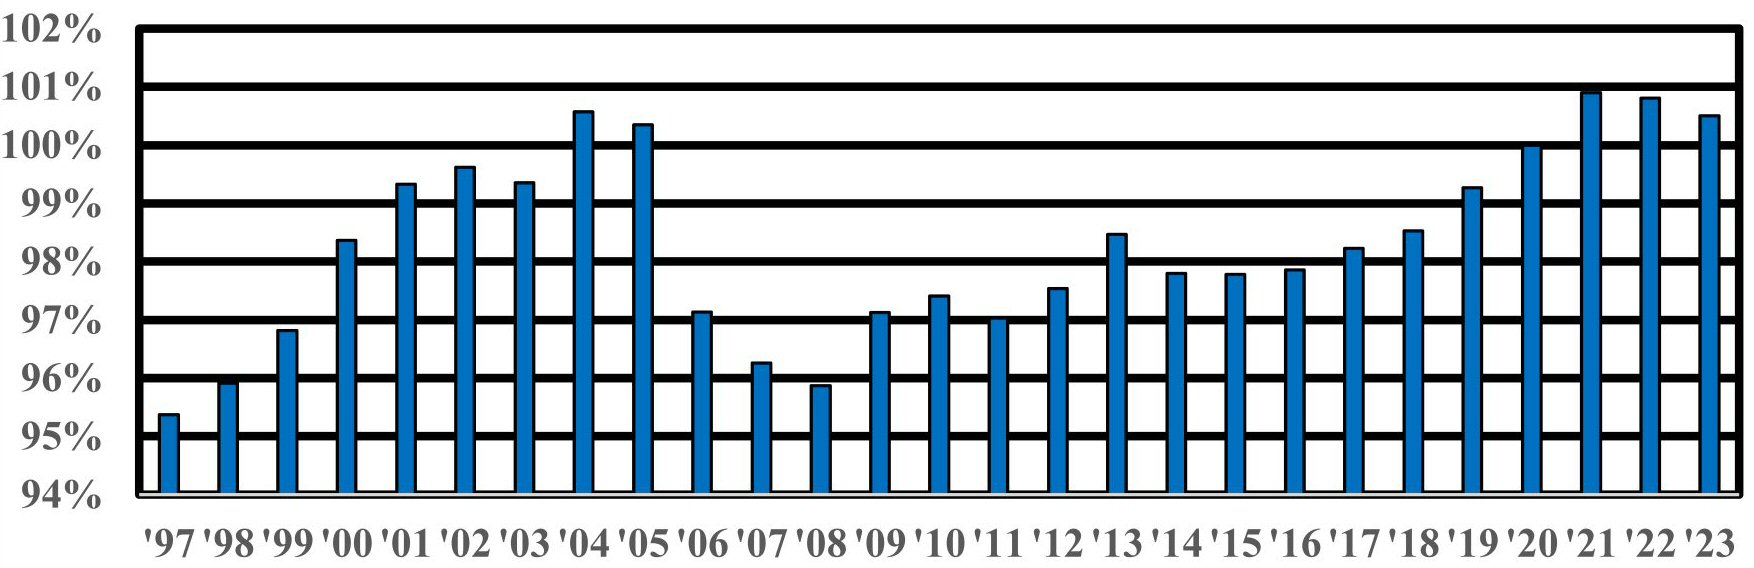
The selling-price to asking-price ratio, expressed as a percentage, is one of the most important statistics available. For buyers, it provides an indication of how much can be negotiated off the average asking price so that expectations are kept within a reasonable range, and so that time is not wasted viewing properties that are priced out of reach. For sellers, the ratio tells how much "fat" is required in the asking-price. It is surprising to find the ratio is so high, almost always greater than 95%. In fact, in a hot market, the ratio averages over 100%!
To set expectations of buyers making an offer when there are no other buyers, calculate an average of only the transactions for which the ratio is less than 100%. A similar calculation of only the transactions for which the ratio is greater than 100% is useful information for buyers in multiple-offer situations.
Calculate the selling-price to asking-price ratio using recently sold similar homes. Divide the total of all the selling prices (reduced by any seller credits) by the total of all the asking prices to find the selling-price to asking-price ratio. Include at least 200 individual sales to ensure an accurate result. The selling-price to asking-price ratio represents critical information; do not rely on a guess or the 95% figure noted above. Obtain an exact, up to date reading, tailored to your needs.
One might also use the selling-price to asking-price ratio as a measure of an agent's negotiating performance: Compare an agent's record with a local average.
[Click here to return to top]
Vacant Homes
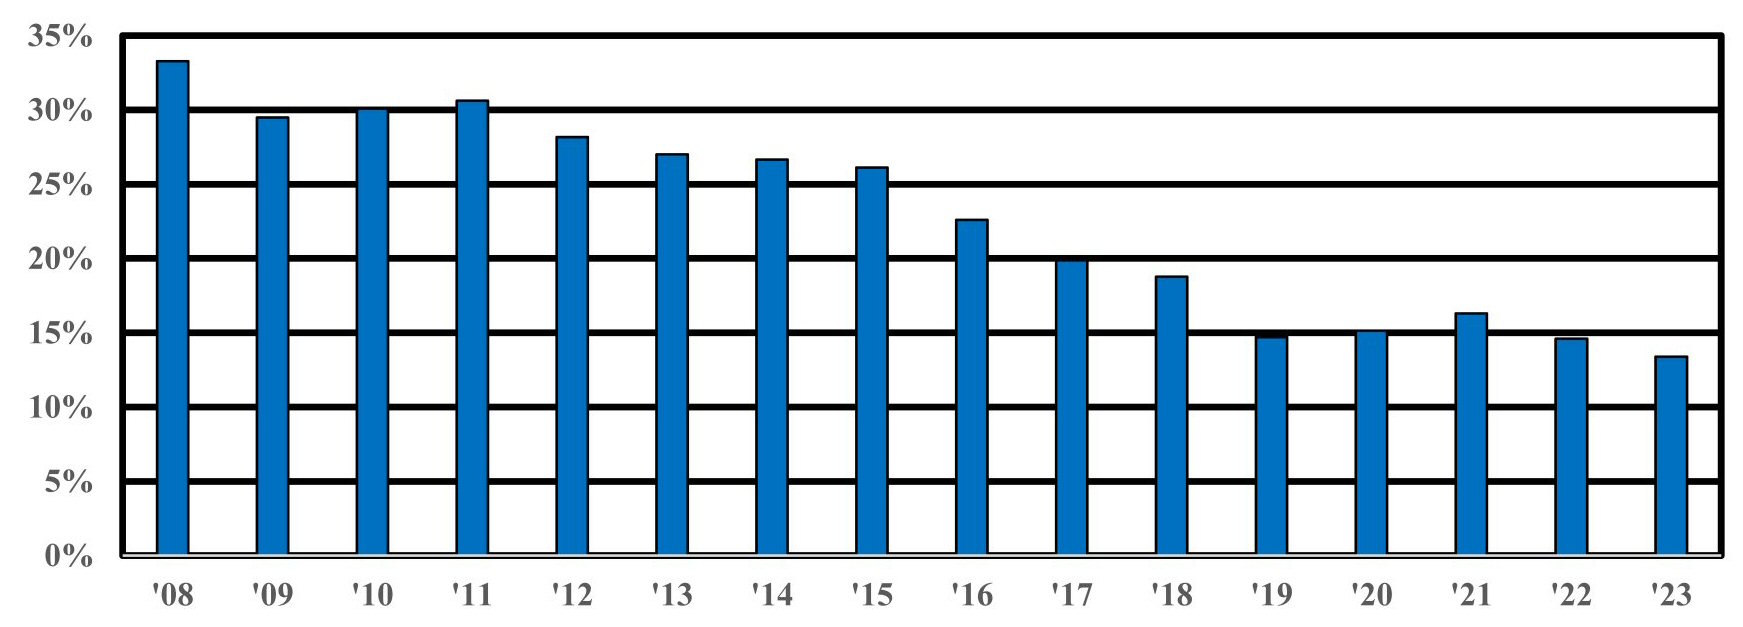
The graph above shows the percentage of vacant homes for sale. If it has been decreasing as shown, it reinforces the notion of a strong market as indicated by low Months Supply and low Days on the Market figures. Vacant homes for sale will increase with the number of job-related moves or foreclosures. It will also increase when folks are able to move into new quarters without first selling their current home.
[Click here to return to top]
Dollars per Square Foot
Yes, size matters, but here's a word of caution: Dollars per square foot is often included by a MLS system. It is an easy concept to grasp but is often misused. While dollars per square foot provides important insight, misuse of the data is one reason a tax-assessed-value and a Zestimate can be off by 30%, and that’s a lot. Some MLS systems make no mention of this figure in order to minimize the inherent dangers.
Figures quoted are always for an average square foot. But a little-known concept (unless you’re an appraiser) is the value of a marginal (or additional) square foot. It is easy to understand that an extra 100 square feet added to a 300 square foot home is of great value. On the other hand, an extra 100 square feet added to a 5,000 square foot home is worth much less.
The value of an average square foot is often $300 to $500. But State-licensed appraisers, who adjust for marginal square feet, are currently using a much lower value. Remember, there are many important factors other than size, that determine property values.
[Click here to return to top]
Tax Assessments and other schemes
A tax assessment is the value a local government assigns to a home for real estate taxation purposes. It has only a very general relationship to that home's market value: It is so general as to be useless. But some will tell you there is a direct relationship. They have not done an analysis, are relying on a very few bits of data, or are repeating "what everybody knows." A careful analysis of the statistics proves them wrong, both over a wide area as well as in an area as limited as a development, project, or subdivision.
One who attempts to predict a market value or contract price from a tax assessment needs to guess a percentage factor to multiply by the tax assessment to obtain the predicted contract price. That would mean correctly guessing a number (the percentage factor) with absolutely no basis for making the choice. Of course, there is some average relationship between tax assessments and market values that can be calculated. But use of an average figure to determine the market value of a specific property should be enough to make even the tax assessor giggle.
Amazingly, elaborate calculation schemes or algorithms (pronounced: Al Gore rhythms) have been devised to predict a market value from tax assessments. Although the mathematics are impeccable and some such schemes have gotten favorable press nationally, and at least one has been patented (Huh?); the fact remains that any calculation using flawed data, yields a result that is inevitably flawed. Garbage in; garbage out. End of story.
Be alert to anyone who tries to draw a conclusion from just a few cases: This is logically as well as mathematically unsound. Also reflect on how long it has been since the tax assessor visited your home. Never?
Zillow, and other such schemes that rely heavily on tax assessments, are just as inaccurate. Zillow tracks their own accuracy and is constantly trying to improve it. Several years ago, they offered a $1,000,000 prize for someone who could improve their accuracy. But still being unhappy with their results, they recently found a way to report that makes their results look better.
There is no substitute for a properly prepared market value analysis or an appraisal. Mortgage lenders do not rely on tax assessments, and neither should you or your audience. In short: The market price of a home is defined by the price paid by a buyer to a seller, neither being under duress, etcetera, etcetera. Anything else is an estimate, and some of them are way off!
[Click here to return to top]
Interest Rates
Interest rates are an important factor in a real estate transaction. Familiar to all, they do not need much explaining: Lower is better for everyone. It is striking to calculate that at the very same monthly payment, one can buy 50% more home at a 4% interest rate compared to 6%!
Buyers and sellers need to keep an eye on changes in interest rates. They can have an important effect on the real estate market, but changes sometimes can have the opposite effect from that reasonably expected: A sudden increase can sometimes trigger buying activity, albeit temporary.
Also, real estate markets do not move in lock-step with mortgage rates: There is often a time lag between interest rate changes and changes in market activity. Finally, the great differences in home price appreciation and depreciation often apparent in different markets across the country are indeed notable, even though mortgage rates are nearly uniform. This suggests that the rate itself is a less important factor than precipitous changes in rates.
[Click here to return to top]
Housing Affordability Index
Consider the interrelationship between interest rates, home prices, and personal income, or purchasing power. When one of these factors experiences a significant change, one or more of the other factors will also be affected. Mortgage interest rates can make significant moves in a short time. Personal income depends upon employment as well as wage and salary levels and therefore it moves more slowly. But personal income and interest rates change independently of each other and are influenced by macro-economic trends. Home prices are caught in the middle as the dependent variable.
For example, if mortgage interest rates move down this means improved affordability for real estate. Even if personal income remains stable, buyers can buy much more for the same monthly payment that they were undertaking previously. This results in upward pressure on home prices. But home prices do not move (inversely) in lock-step with mortgage rates. Home prices can be held in check by economic worries, a large resale home inventory, or economic malaise. On the other hand, they can increase quickly in hot markets without any change in mortgage interest rates.
So the housing affordability index is not fixed, but varies greatly with time and location. Examination of affordability in various markets across the U.S. presents quite a diverse picture. Further, what is the housing affordability index in Honolulu? Hong Kong? Tokyo? London? Get the idea? The Index is an interesting but useless piece of data for home buyers and sellers.
So what is important? Buyers need information to determine their own personal home affordability. An Index helps fill a news spot, but it is an otherwise useless manufacturversy.
[Click here to return to top]
New Home Data
New homes account for roughly 10% of home sales, but the actual volume can expand or contract radically due to changing economic conditions. For you economist buffs, this is called elasticity of supply. Reliable data for this market segment is available from the National Association of Home Builders (NAHB). For the individual home seller, zero new home construction would be ideal. For buyers, the more, the merrier.
While most home buyers consider new homes as well as resale homes, individual home sellers need to be especially vigilant when considering their marketing strategy if comparable new homes are available nearby. National and regional data reported often include new home sales, housing starts, permits issued, etc. But new home construction is neither controllable by, nor significant for most buyers and sellers. It's just a "blip" on the curve.
[Click here to return to top]
Average vs. Median
Both average and median values can be calculated for almost any set of data, including, home prices, days on the market, and selling-price to asking-price ratio. Since both average and median values tend to rise and fall in unison, it seems needless to report both. It is suggested that only the average values need be reported, because the concept of an average needs no explanation.
It should be noted that median values for home prices and days on the market are generally lower than the averages for those data sets. For you statistics buffs, this is due to the skewness of the data. Median values for selling-price to asking-price ratio are usually higher than the averages, but sometimes the opposite is true. Such a reversal is most likely in an especially hot spring market, no doubt due to a change in the skewness.
There is another statistical measure called the mode. While it might be useful in some cases, it requires too much explanation. It is therefore suggested that it not be considered, unless preceded by "pie ala-."
[Click here to return to top]
Methodology
As a rule, the best data avaiable is from a regional MLS system. The most important statistic is the Months Supply of homes on the market. One might find that the best month for home sellers is March, not June to August as others keep telling us. Be sure to track pending sales (contracts entered) not closings.
Home buyers and sellers need the very best and most timely information. But many reports are two to six months out-of-date because they are based on closings, not pending sales and are generally not published in a timely manner. Some reports may be distorted by rental, and new home information. Further, some sources calculate Months Supply including pending sales along with homes on the market in the numerator of the fraction. This distorts the calculation since most agents and buyers consider that pending sales are not fully available and do not view them.
One government report on average home prices is heavily based on re-finance appraisers' opinions which clearly are not pertinent, and another widely quoted measure of prices employs an algorithm so arcane as to make its data useless! Finally, it bears repeating (again and again) that although data can be collected and averages can be calculated, there is no national real estate market. While national data is interesting, to help individual buyers and sellers with actionable information, you will need regional data.
[Click here to return to top]
APPENDICES
What are they talking about?
Putting real estate information into perspective . . .
(written in 2008)
Why are the "pundits" telling us all this baloney? What do they think we should do? Sell our homes and live with mommy and daddy? With the kids? In a tent? Stop buying homes? We'd be happy if the Wall Street folks could give us an accurate prediction of the stock market, where they should be the experts! We'll be a bit worried when Realtors on TV start telling us what stocks to buy!
Here are important questions when compiling information:
- What decreased 3%? The number of sales or home prices?
- For what time period? Compared to when? Last month? Last year?
- Did they consider seasonality?
- Is the data recent, or several months old?
- From what perspective? There are different views if data tracking starts in 1990 versus 1998, 2006, or 2009!
- What is included? Resale homes? New homes? Both? Rentals? Re-finance appraisals? Yikes!
- Is the data for a well defined area? There are regional markets, but there is no national real estate market. Although national averages can be calculated they are merely useless bits of information for individual homeowners.
- Do they support their conclusion with meaningful data or do they start with a conclusion and support it with anecdotal evidence? An example or two can illustrate a view, but not prove it.
- Do they understand that the value of a home is defined by a buyer-seller, arms-length transaction or do they seek to project their personal opinion of home values? The real price of a home (or all homes) is never defined by some third-party's opinion, even if they are recognized as experts.
- Are they confusing the homes we live in with shares of stock?
Examine the underlying data and ask:
- Do they comprehend the concept of statistical significance? This answers the question: Does the number just calculated actually mean something? This is of great importance when considering average home prices. When the sample size (number of data points) gets too small, results bounce and such reports are useless. Further, there are much more important data than home prices for buyers and sellers.
- Does the algorithm being used make sense? What does it include and exclude? No one actually adds up all the home prices and divides by the number of homes on a national scale. Delve into the method.
- Are they careful to make the distinction between correlation and causal effect?
- Have they been tracking their data over several decades? The National Association of Realtors data seems to be respectable. (I'm a member not a fan.)
- In the questionable category are the Standard & Poors-Case-Shiller Index and the government's data from the FHFA (just Google it).
Of course, radio and TV news spots and newspapers have time and space constraints that make answering all the above questions impossible. So, it's up to you to decipher the truth. News should be more than a recreational activity!
Remember that "what everybody knows" is not always right, even when it sounds right. Get real estate advice from real estate folks, not Wall Street lemmings. Monitor economic conditions including employment, and most importantly, housing supply and demand: Yes, the Market Index, aka the months supply of homes. Help those making really important decisions about their personal housing!
* * * * * * * Click here to return to top * * * * * * *
Are home values dropping 12% monthly?
Are homes in the new Amazon second headquarters ZIP code (22202) losing value at 12% every month? Unfortunately, readers of a respected publication got bad information in 2019. A couple months earlier they reported that homes were appreciating 72% a month. They can calculate a median from just 12 sales in a month, but it is meaningless. This was obvious to many (except their editors) with a look at their chart which clearly showed excessive bounce. Why repeatedly publish statistical NOISE and call it news?
When there are so very few data points per month, the median price has a lot of "bounce to the ounce" (i.e., volatility). So, the sky is not falling: Home values are not decreasing 12% each month nor appreciating 72%!
* * * * * * * Click here to return to top * * * * * * *
We won't get fooled again! Or will we?
A self-fulfilling prophecy!
We periodically hear the financial gurus beating the "housing bubble" drum. Indeed, housing price averages in many markets are back to pre-crisis levels. Fast-backward to 2006: Various financial news folks had been grousing about the housing bubble for at least 4 years.
The problem was not 100% loans or very low down-payment loans which had been readily available since 1944. The problem was not interest only loans, or adjustable rate loans (ARMs), or any other kind of loan. All these types of loans had been around for many decades and are still with us today, but all were cited repeatedly as the source of the supposed bubble. Note that ARMs, which have been readily available in the United States since 1981, are the norm in most of the world, where fixed-rate mortgages are rare.
The real problem was; ignoring existing guidelines and throwing caution to the wind. It was a case of the money lenders not doing their job. IRS Form 4506-T, provided by borrowers, allows lenders check the income stated on a borrower's tax returns. Any mortgage fraud on the part of borrowers and loan initiators could have been easily spotted at several links in the lending chain. But the folks lending the money were not into due diligence.
And all might have been fine if the Fed had not been listening to the news media. Assuming responsibility to head off the alleged bubble, the Fed began raising rates in June 2004. By June 2006 short term rates had increased from 2.5% to 6.75%: Way too fast. (Alan never called for my advice, even though we once shared a Board Room in New York City albeit on different days.)
The effect on 1-year ARMs was delayed a bit, but home owners with these loans saw their monthly payment double. The foreclosure stage was set, and by the end of 2008, home prices had cratered.
The resulting financial debacle exacerbated on Wall Street by derivatives, credit default swaps, etcetera had its own greedy undertone; but it might never have occurred without "help" from the excessive number of foreclosures caused by needlessly high interest rates.
The assumption that the crisis resulted from normal market (boom and bust) forces, is faulty, misleading, and dangerous. Maybe the financial media folks should just try to tell us what will happen on the stock market tomorrow.
The above is a brief summary. For the whole story click here.
* * * * * * * Click here to return to top * * * * * * *
A market report
It was surprising to see this sentence in an article written by 3 university experts, to inform Realtors of current market conditions. “The data may have represented conditions that occurred four months before it is published.” This is an exceptionally candid comment, referencing similar articles published in the past; and old news is bad news.
The article appeared in a bimonthly magazine published by an Association of Realtors. If the 4-month-old data was quoted by Realtors for the following 2 months, that totals 6 months. Since there is often 6 months between a best market and a worst market, anyone relying on this information would be perfectly out of phase.
* * * * * * * Click here to return to top * * * * * * *
An Interesting Question
even the BIG boys can mess up
A faithful reader (Steve) once asked why the Wall Street Journal (WSJ) was reporting that home prices decreased 5.8% in a healthy market?
An Answer: The WSJ cited their "quarterly survey" as the data source. Apparently, they did not use data available from an MLS system, and likely had no concept of statistical significance. 5,000 to 10,000 transactions are needed to have a reasonable confidence level for an average-price calculation and to avoid results that are meaningless. Developing some numbers and calculating an average is not good enough.
* * * * * * * Click here to return to top * * * * * * *
Discrimination in housing: Perspicacity
an interesting perspective
Perspicacity is the ability to discern a difference. For example, if you visit a home whose real value is $450,000 and a second one whose value is $550,000 you will know immediately which is which. However, if you see a home whose real value is $499,000 and a second one whose value is $501,000 you have only a 50/50 chance of guessing which is which. The minimum level where most folks can discern any difference is 5%; this is one quantum level of perspicacity.
So what?
Sellers should consider this when setting their asking price. Sellers who price too high will have no offers to negotiate. Why? Because buyers who can afford a home worth more, are looking for a better home. They do not want to give up one level of perspicacity, even if they could buy the home at a 20% discount.
Further, when considering a price reduction, amounts smaller than 5% are not significant to the market. Sellers must reduce their price so that they are competing with homes at least one level of perspicacity lower!
If home buyers see a home that has been on the market for too long at its current price, it is overpriced by at least 5%. Also, if buyers find they are not seeing homes that are acceptable, they will need to increase their maximum search price by at least 5% in order to find happiness.
* * * * * * * Click here to return to top * * * * * * *
You could be getting misinformation,
and never know! Scary?
A 2019 article in a Realtors magazine reported average days on the market (DOM) twice the actual value. Why? A new MLS system had started reporting DOM in a strange way. After a month or two the MLS realized the mistake and told their members they would correct it. But they continued to provide data that was useless for about another year, and very few (including Realtors) ever knew.
* * * * * * * Click here to return to top * * * * * * *
* * * * * * *
AFiRE — Licensed broker in Florida and Virginia
A Friend in Real Estate, LLC

* Copyright © David Rathgeber *
* * All rights reserved. * *