David Rathgeber's
The Market Recovery
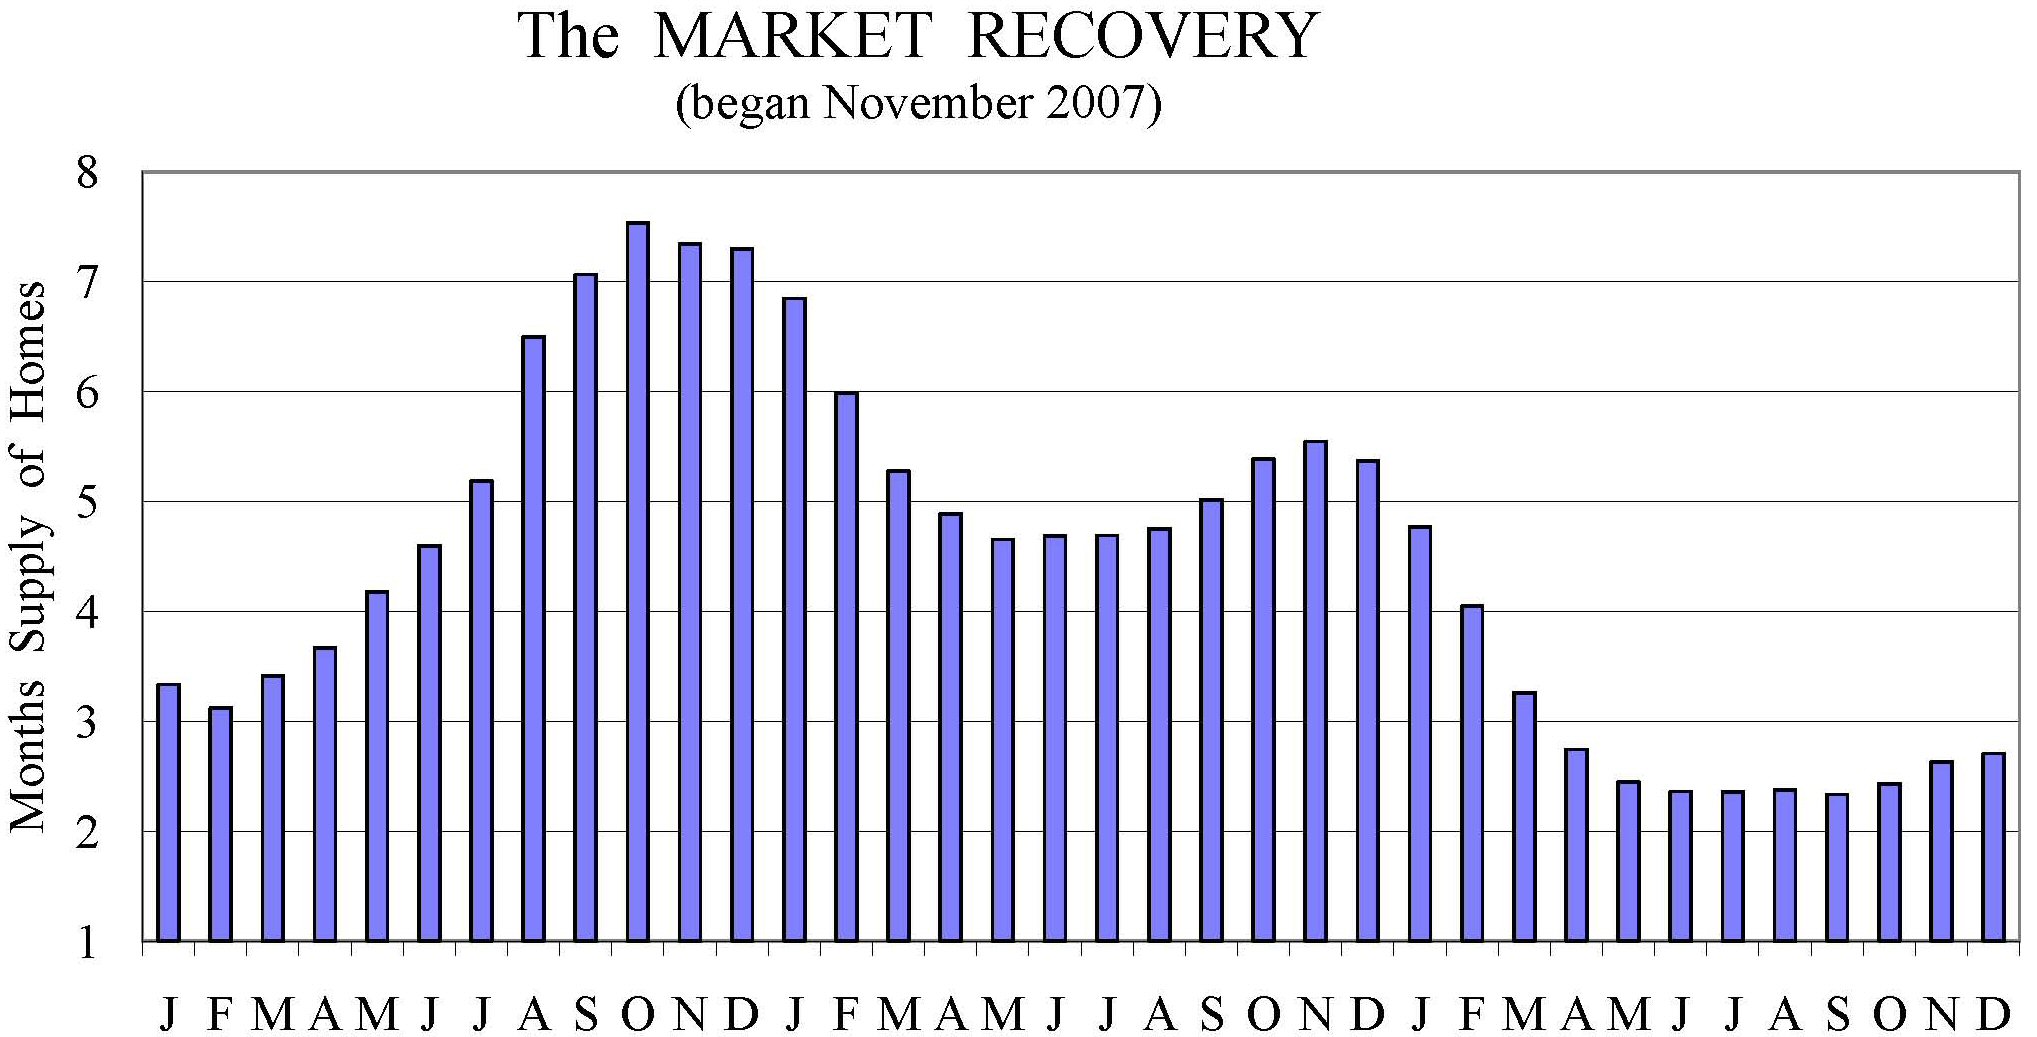
The graph above displays the Market Index for 2007, 2008 and 2009. It is clear that our local market has been strengthening since late 2007. The months supply of homes is calculated by dividing the number of homes on the market by the number of homes sold in the same month. A number greater than 5 favors buyers. A number lower than 3 favors sellers. The graph indicates the health of our local market but does not address the level or direction of home prices.
Click to see months supply 1991 to present.
* * * * * * *
AFiRE — Licensed broker in Florida and Virginia
A Friend in Real Estate, LLC

* Copyright © David Rathgeber *
* * All rights reserved. * *